Write better code with SonarQube
Table of Contents
In this blog post I introduce a SonnarQube, a static code analytic tool, which can help you write more secured, less buggy and cleaner code. I show how to run it and play around with it.
Have you recently started to code in your free time? Or maybe you’re a full-time senior developer with couple years experience? No matter how long you’re in software engineering sometimes it’s hard to write nice and clean code. Especially when you’re working on a complex project.
The best solution would be to program in pairs with another developer or ask her/him to check what you’ve written in a code review. But sometime you don’t have anyone around to help you. Luckily there is solution for this problem — static code analysis tool. Of course it won’t be the same as human, but still can help you a lot with your work.
But wait, what’s static code analysis tool?
Based on special algorithms these tools analyze the code we write and look for bugs, possible security breaches, code smells and presents it in the some kind of report that helps us, developers, find issues in our code. Moreover they can check the unit test coverage, to make sure that all crucial parts of the logic are properly tested.
Such tools not only help developers find possible mistakes, but they also allows companies to become more into DevOps culture, where programmers get instant feedback about their code quality and prevent moving possible vulnerable feature into production environment.
An example of such tools (for Java) are: Findbugs, PMD and SonarQube. And I want to talk about the last one more briefly in this blog post.
SonarQube #
To learn about all its features let’s install it and check on some of my project. Therefore you need to have an instance of SonarQube Community Edition up and running on your local machine.
I prefer to use Docker image for that (I’ve recently try dockerize everything), but you can go with regular installation from a zip file. The instructions are available on the official website. All mine instructions are valid also with this approach (you only need to skip the Docker part).
Prerequisites #
In order to follow my instructions you will need install:
Docker — instructions for Ubuntu , Windows , Mac (if you’re on Ubuntu, you’ll need also to install Docker Compose separately),
Maven — official installation guideline.
Docker Compose #
Once you’ve got installed all prerequisites we can move to setting up the SonarQube Docker container. I would like to use sonarqube:7.9-community Docker image, but there are also two additional things that I would like to configure:
by default, all the analysis are saved in H2 database, I want to change it, so all of them will be stored in the PostgreSQL,
I would like to enable SonarQube Server configuration with sonar.properties file.
As the result I’ve came up with following structure of a folder:
    develop-env/
    ├─ docker-compose.yml
    └── sonar/
       ├── Dockerfile
       └── sonar.properties
First, let’s focus on sonar folder, which contains a Dockerfile(recipe for an image):
FROM sonarqube:7.9-community
COPY sonar.properties /opt/sonarqube/conf/
and sonar.properties file:
sonar.junit.reportPaths=target/surefire-reports
sonar.coverage.jacoco.xmlReportPaths=target/site/jacoco/jacoco.xml
Dockerfile is pretty straightforward, it uses official sonarqube:7.9-community image and copy paste the sonar.properties file into it. The second file is responsible for telling Sonar where to look for reports related to test coverage.
Next, let’s move on to docker-compose.yml file.
version: '3'

services:
  sonarqube:
    build: ./sonar
    ports:
      - 9000:9000
    networks:
      - sonarnet
    environment:
      - sonar.jdbc.url=jdbc:postgresql://sonar-db:5432/sonar
    volumes:
      - sonarqube_conf:/opt/sonarqube/conf
      - sonarqube_data:/opt/sonarqube/data
    links:
      - sonar-db

  sonar-db:
    image: postgres:9.6-alpine
    networks:
      - sonarnet
    environment:
      - POSTGRES_USER=sonar
      - POSTGRES_PASSWORD=sonar
    volumes:
      - postgresql:/var/lib/postgresql
      - postgresql_data:/var/lib/postgresql/data

networks:
  sonarnet:
    driver: bridge

volumes:
  sonarqube_conf:
  sonarqube_data:
  postgresql:
  postgresql_data:
In a nutshell it tells Docker to create two containers: sonarqube and sonar-db. First one is an instance of a SonarQube Server, and a second one is its database.
Now you can start the server, therefore open the terminal in a folder where docker-compose.yml is located and type:
docker-compose up -d
After few minutes you should be able to enter the main page: http://localhost:9000.

If your SonarQube Server is not starting probably it’s related to ElasticSearch memory limitation. The solution to this problem can be found on the Stack Overflow.
Maven configuration #
Once we have SonarQube Server up and running let’s enable our projects to be able to generate reports that than can be consumed by SonarQube Server.
Therefore we need to configure SonnarScanner, as the name may suggest, a tool for scanning projects. There are couple approaches for achieving this. All of them are described on the official website.
I‘m picking a Maven approach because I’ve used it in my recent project. First step would be to set up global configuration of Maven, so go to your’s .m2 folder (it’s usually located in user root folder, more information about it you can find here) and add (or adjust if you already have) the settings.xml file.
<settings>
    <pluginGroups>
        <pluginGroup>org.sonarsource.scanner.maven</pluginGroup>
    </pluginGroups>
    <profiles>
        <profile>
            <id>sonar</id>
            <activation>
                <activeByDefault>true</activeByDefault>
            </activation>
            <properties>
            </properties>
        </profile>
     </profiles>
</settings>
Project’s POM config #
After setting up the global configuration of Maven you can go to your project.
For demonstration purposes I’m using my recent project - Kanban-app, which is a Java (Spring Boot) based REST application.
The only thing that I would like to add here is a JaCoCo Maven plugin that will generate a code coverage report which can be used by SonarQube (if don’t want to have such report you can skip this part, but I strongly recommend to have it).
Therefore, open pom.xml file in your project and in the section build and then plugins add following lines:
<!--- some dependencies --->
<build>
	<plugins>
    	<!--- different plugins --->
		<plugin>
			<groupId>org.jacoco</groupId>
			<artifactId>jacoco-maven-plugin</artifactId>
			<version>0.8.4</version>
			<executions>
				<execution>
					<id>default-prepare-agent</id>
					<goals>
						<goal>prepare-agent</goal>
					</goals>
				</execution>
				<execution>
					<id>default-report</id>
					<phase>prepare-package</phase>
					<goals>
						<goal>report</goal>
					</goals>
				</execution>
			</executions>
		</plugin>
	</plugins>
</build>
Running the analysis #
Everything should be set up now, so let’s run our first analysis!
But before that, make sure that your SonarQube Server is running. Then go to your project and either in your IDE or in the terminal run following command:
mvn clean verify sonar:sonar
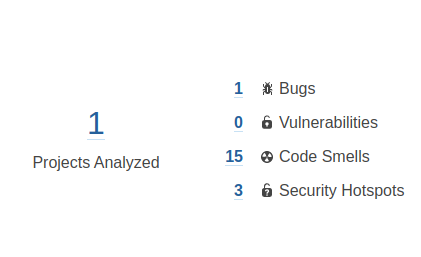
And then enter the SonarQube — http://localhost:9000 and you probably see the number of projects that was analyzed.

To get more details click Projects icon (at the top bar):

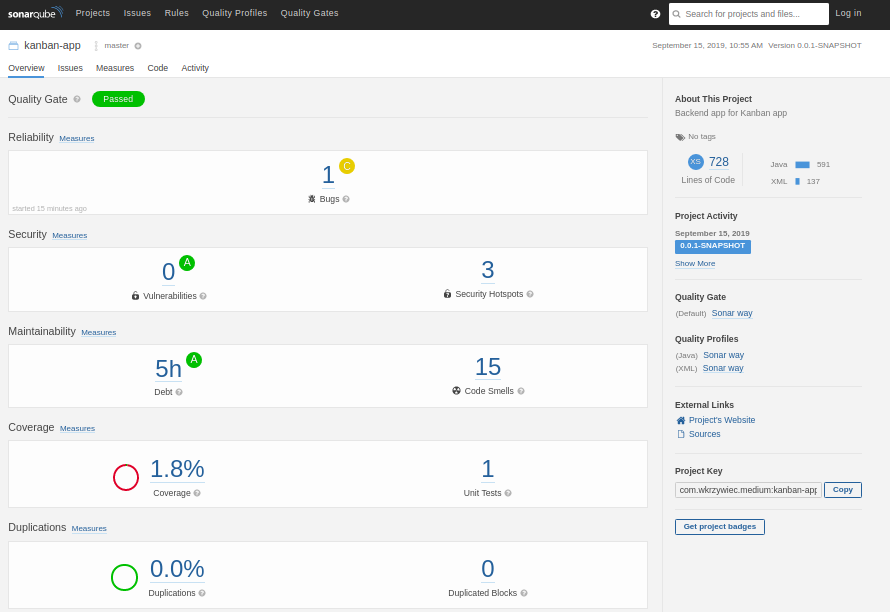
And then click on the project name that you would like to check. In my case it’s kanban-app.
In the new window you’ll see several issues that were discovered during the analysis. They can be Bugs, Security Vulnerabilities, Code Smells, Duplications or Code Coverage.

By clicking on each one of them you should get more detailed report. For example, when I click on Code Smells issues I’ve get following report.

I can even dig deeper into it and find out in which line of code has the code smell.

These kind of reports are similar for every kind of an issue, except for Code Coverage, to which I would like to move on.
When you enter it you should get similar report:

From my report you can see that the entire test coverage for my project is really low, so let’s fix it!
First, let’s see if all classes needs to be tested. If you look closer you might see that the report includes some model and configuration classes for which writing unit test is rather pointless. Therefore we need to exclude them from the report.
To do so, open pom.xml file once again and in <properties> section add <sonar.exclusions> section in which you need to provide packages and/or classes that you want to exclude from the coverage report:
    <properties>
       <!--- Other properties --->
       <sonar.exclusions>
          **/model/**,**/config/**,**/KanbanApplication.java
       </sonar.exclusions>
    </properties>
More information about the syntax could be found on the official website.
Second thing to do is to write new unit tests that will cover untested parts of the code. To get to know which lines of code are not tested, move back to the report and pick a class that you would like to check.

On the left, there are green and red blocks that indicates if this part of the code has unit tests.
Once you know which methods are not tested yet, roll up your sleeves and start to write some test.
After you’re finished with unit tests, rerun the analysis, with the same terminal command
mvn clean verify sonar:sonar
And refresh the SonarQube report page and you should get a new report.

As you can see my test coverage is still pretty low, but with SonarQube I’ll be able to fix it really quick!
And that’s it! If you want to see a full code of my project you can go to my GitHub repositories:
- with SonarQube Docker Compose
- with kanban-app
